
Hamilton conducted the survey in 2011, 2015 and 2017. Some 1,017 participated in 2017, 443 answering a mailed survey, and the rest responding to online opt-in questions. The organization reported a 3 percent margin of error.
“Their results from previous surveys increased dramatically,” said Angelica Wedell, the marketing director at National Research Center. “When it came to questions regarding economy and questions regarding recreation and wellness, residents gave much higher ratings in those areas than they had in previous years. That level of improvement was higher than all the other jurisdictions that were surveying in the same year across the country.”
“It’s very impressive,” Wedell said. “When we’re looking at level of improvement with resident surveys, generally it’s good to have a trend-line and compare with yourself, but the thing is that we have this national data that lets us see how jurisdictions are doing in comparison with the rest of the country.”
“It really is difficult to not only be above a benchmark in a certain benchmark or improve that much,” she said. “It’s that level of improvement that is what’s really impressive.”
Also, “We like to see that they’re doing something to earn those results — what kind of best-practices they’re employing,” she said.
City Manager Joshua Smith called the survey “a great way to get feedback from the community.”
“We strive to understand from our residents and businesses, ‘What are truly desired services?’” Smith said. “Once we better understand the answer to that question, we can continue to build our organization to be results-focused with services that truly matter to our community.”
Some 44 aspects of the community saw better ratings in 2017 than in 2015, compared with eight areas that saw declines.
The National Research Center plans to write a case study highlighting for other communities what Hamilton has done to create improvement.
“Hamilton has been having a lot of changes in the downtown area, for example,” she said. “They started having a lot more new jobs in the area, so I’m sure residents were able to find work better and have more disposable income, and be able to spend in the downtown area.”
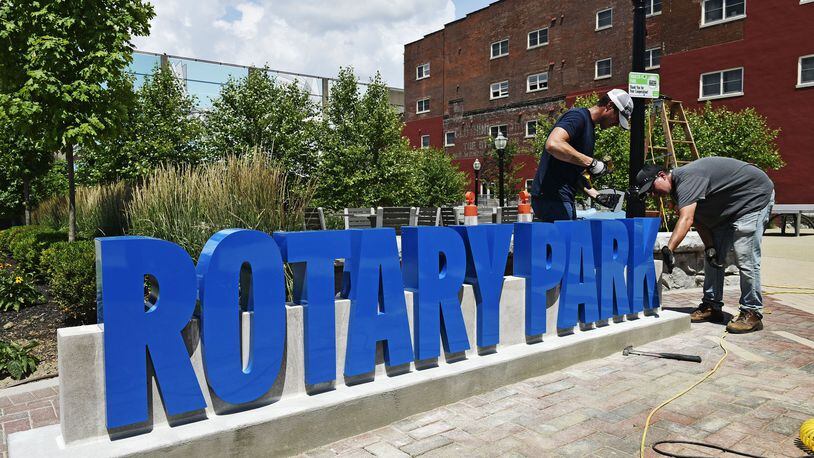
“They also started doing things like taking historic buildings, and renovating them, and getting these older neighborhoods, and getting them rehabilitated,” she said. She also noted Hamilton’s parks have seen great improvement, largely because of the non-profit Hamilton Parks Conservancy, “and it looks like doing that, they were actually able to get improvements in the parks done that maybe the city itself may not have been able to foot the bill for those kinds of things.”
• • • •
SURVEY SAYS
Here’s how Hamilton residents in recent years rated various aspects of their city by giving positive ratings in these overall categories.
The percentages represent positive answers ranging from “somewhat good” to “excellent.”
• Overall quality of life: 40 percent in 2011; 48 percent in 2015; 49 percent in 2017.
• Overall image: 21 percent in 2011; 24 percent in 2015; 26 percent in 2017.
• Place to live: 47 percent in 2011; 56 percent in 2015; 58 percent in 2017.
• Neighborhood: 55 percent in 2011; 61 percent in 2015; 62 percent in 2017.
• Place to raise children: 40 percent in 2011; 45 percent in 2015; 50 percent in 2017.
• Place to retire: 31 percent in 2011; 35 percent in 2015; 40 percent in 2017.
• Overall appearance: 28 percent in 2011; 39 percent in 2015; 46 percent in 2017.
• Overall natural environment: 37 percent in 2011; 47 percent in 2015; 58 percent in 2017.
• Cleanliness: 25 percent in 2011; 27 percent in 2015; 41 percent in 2017.
• Overall built environment: Not asked in 2011; 41 percent in 2015; 53 percent in 2017.
• New development: 31 percent in 2011; 47 percent in 2015; 62 percent in 2017.
• Public places: Not asked in 2011; 31 percent in 2015; 51 percent in 2017.
• Overall economic health: Not asked in 2011; 21 percent in 2015; 35 percent in 2017.
• Vibrant downtown/commercial area: Not asked in 2011; 23 percent in 2015; 48 percent in 2017.
• Employment opportunities: 8 percent in 2011; 22 percent in 2015; 33 percent in 2017.
• Place to visit: Not asked in 2011; 30 percent in 2015; 42 percent in 2017.
• Health care: 36 percent in 2011; 47 percent in 2015; 49 percent in 2017.
• Recreational opportunities: 24 percent in 2011; 39 percent in 2015; 50 percent in 2017.
• Fitness opportunities: Not asked in 2011; 52 percent in 2015; 59 percent in 2017.
• Cultural/arts/music activities: 29 percent in 2011; 58 percent in 2015; 68 percent in 2017.
• Overall direction of government: 27 percent in 2011; 56 percent in 2015; 65 percent in 2017.
• Recreation centers: 43 percent in 2011; 38 percent in 2015; 59 percent in 2017.
About the Author